Measurement data acquisition, analysis and visualization with charge amplifiers and software from Kistler
Explained in 4 minutes


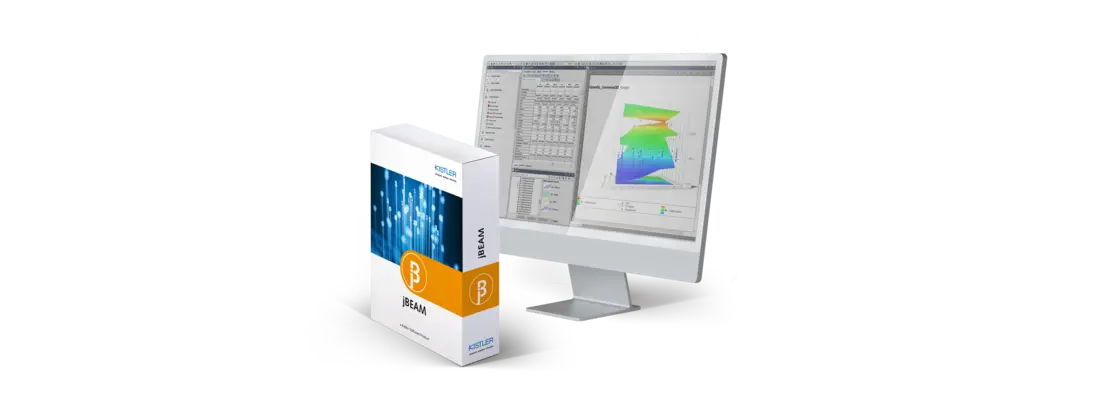
jBEAM – the comprehensive software solution for analyzing, visualizing and reporting on measurement data. jBEAM can be used both as a desktop program and in web-based measurement data management (MDM) systems such as MaDaM.
Numerous vehicle manufacturers and their key suppliers have already chosen our platform-independent, multilingual software: for their research and development processes, jBEAM provides them with a strategic, global solution that includes both universal and application-specific data analysis, calculation and reporting capabilities.
Explained in 4 minutes


jBEAM enables comprehensive analysis of engine test data thanks to features such as automatic detection of speed/manifold pressure test points based on continuous time signals. Map matrices are calculated and visualized either on a mathematical level or for display purposes. Difference plots showing map differences between two tests are also supported. As an additional benefit, jBEAM allows interactive fitting: manually changeable cursors make it possible to define sections through the maps which can then be calculated and compared. By default, jBEAM supports combustion engines as well as electric motors in two operating modes (operation as motor or generator). ISO power lines can be added to the graphical representation in no time at all.
![Full-scope visualization and analysis of your measurement data [object Object]](https://kistler.cdn.celum.cloud/SAPCommerce_Document_Preview/961-390e.webp)
![Postprocessing of measurement data in distributed working processes [object Object]](https://kistler.cdn.celum.cloud/SAPCommerce_Document_Preview/961-400e.webp)
![Evaluate measurement data with jBEAM [object Object]](https://kistler.cdn.celum.cloud/SAPCommerce_Document_Preview/691-676e.webp)
![jBEAM Durability [object Object]](https://kistler.cdn.celum.cloud/SAPCommerce_Document_Preview/961-532e.webp)
![Put your measurement data in the best possible hands! [object Object]](https://kistler.cdn.celum.cloud/SAPCommerce_Document_Preview/961-982e.webp)
![Process in view - operation under control [object Object]](https://kistler.cdn.celum.cloud/SAPCommerce_Document_Preview/961-995e.webp)